

Pann Phetra
Bangkok, Thailand — open to full-time roles

I'm Pann.Business Analyst

I start with the business pain, then solve it with whatever fits: product, data or AI. I co-founded an EdTech SaaS, used customer data to rework a festival pop-up in Japan, and built my own AI agent.

4 yrsco-founder, OpenMirai
80%merit scholarship, APU
4working languages
Featured in APU's Undergraduate Prospectus 2027
Pann Phetra in a white henley on a sunny street in Japan
Highlights

Selected work

A product I co-founded, a marketing-budget analysis for Google's online store, an AI agent I run and a kakigōri pop-up.

VentureOpenMirai
2021–2025

OpenMirai

Co-founded an all-in-one platform for tutors and academies to launch branded online schools, with zero commission on course sales.

4 yrs · strategy & marketing · EN · TH markets

Visit openmirai.com
Data · Google capstoneThe next marketing dollar
2026

The next marketing dollar

Where should Google's online merch store spend its marketing budget? I found 41% of its revenue came from Google's own employees, then rebuilt the channel credit and a retargeting model.

903,653 visits · BigQuery · Python

Read the case study
AI engineeringIris: an always-on AI agent
2026

Iris: an always-on AI agent

A self-hosted assistant that briefs, sorts, tracks and drafts, with multi-model routing, privacy rules and monitoring.

Live since Sep 2026 · 6 model roles

Read the case study
Small businessKakigōri pop-up
2025

Reading the crowd

A student kakigōri pop-up at two Beppu festivals: permits in my fourth language, a customer tally between the nights, and a price ladder at closing time.

≈¥500,000 in sales · ≈1,000 cups

Read the story
Journey

2019 to today

Work, a four-year startup, study in Japan and community projects, on one timeline.

  • Work
  • Venture
  • Education
  • Community & certificates
Portrait of Pann Phetra in a black suit
    Where I fit

    Ready now for these roles

    Based on my work experience and coursework. This is my own assessment.

    1. 01Business AnalystOpendream BA on EGAT i-Budget
    2. 02Solutions ConsultantCo-built and sold OpenMirai; reworked a pop-up from customer data; built Iris end to end
    3. 03Data AnalystA Google capstone on 903,653 store visits, a 23,593-record panel analysis and a 450-cup customer tally

    Also a fit: Associate Product Manager · Digital Transformation · Growth & Product Marketing · EdTech Product · BD / Sales · Customer Success · Sustainability / ESG Analyst · Travel & Hospitality Tech

    Coursework by role on Education

    Experience · Pann Phetra

    Experience

    Work, venture and volunteering

    WorkMar 2026

    Opendream

    Bangkok · On-site

    Business Analyst Intern · EGAT i-Budget

    • Business analyst on i-Budget, the enterprise budget-management system for EGAT, Thailand's national power utility, during development and user rollout.
    • Ran functional testing across core budgeting workflows and documented defects, system behavior and user processes for the development team.
    • Onboarded EGAT officers through hands-on system walkthroughs during rollout.
    • Turned end-user feedback into clear fix and improvement requests, closing the loop between users and developers.
    Functional testingStakeholder feedbackUser onboardingSAP ERP context
    Read moreShow less: about EGAT and the project

    The Electricity Generating Authority of Thailand (EGAT) is a state enterprise under the Ministry of Energy. It is Thailand's largest electricity producer and runs the national transmission grid.

    i-Budget supports how an organization of that size plans and manages its budget. A business analyst on a project like this translates how finance and operations teams actually work into clear requirements the development team can build.
    Side ventureJul – Aug 2025

    Kakigōri pop-up

    Beppu · Student team of five

    Vice leader · Permits, pricing & customer data

    • Sold shaved ice at two Beppu fireworks festivals with a Thai, Taiwanese and Japanese student team: about ¥500,000 in sales over two festival nights.
    • Handled the permit paperwork in Japanese, my fourth language, with the health centre and festival organizers.
    • Used night-one customer data to rework night two's menu, flavours and stock, and cut prices through the evening to trade margin for volume.
    • Then set up a five-day stand at Beppu City Hall with a teammate, working three of the days.
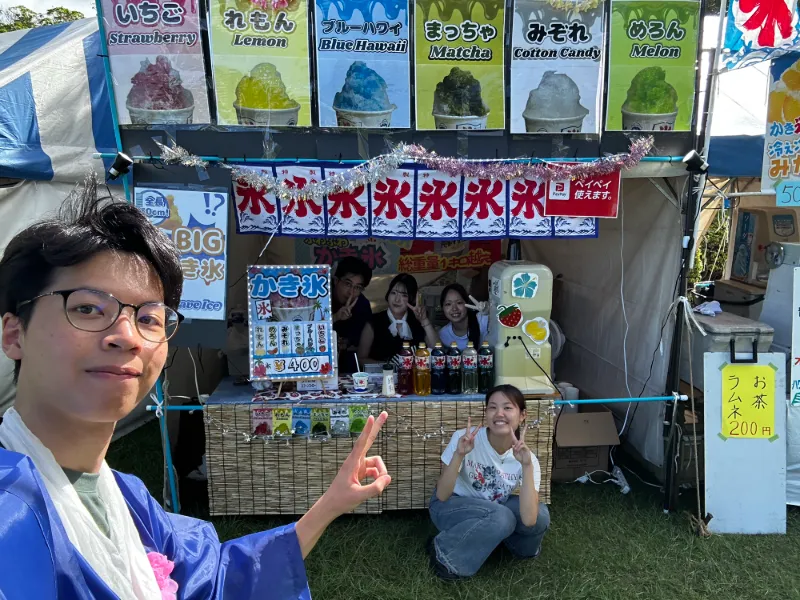
    Pann taking a selfie in front of the team's shaved-ice stall, with teammates behind the counter
    27 July · Hi no Umi Festival stall
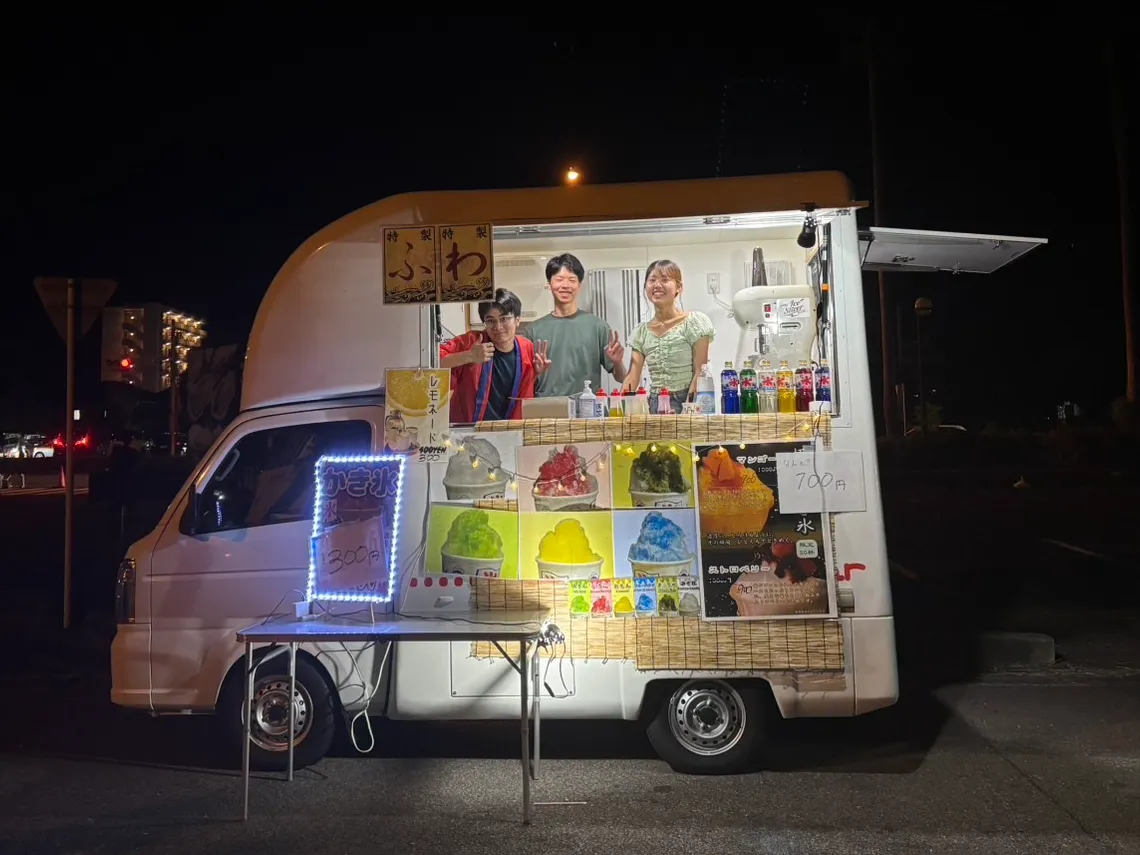
    The team's shaved-ice food truck lit up at night, with Pann and two teammates in the window
    2 August · Kamegawa Summer Festival truck
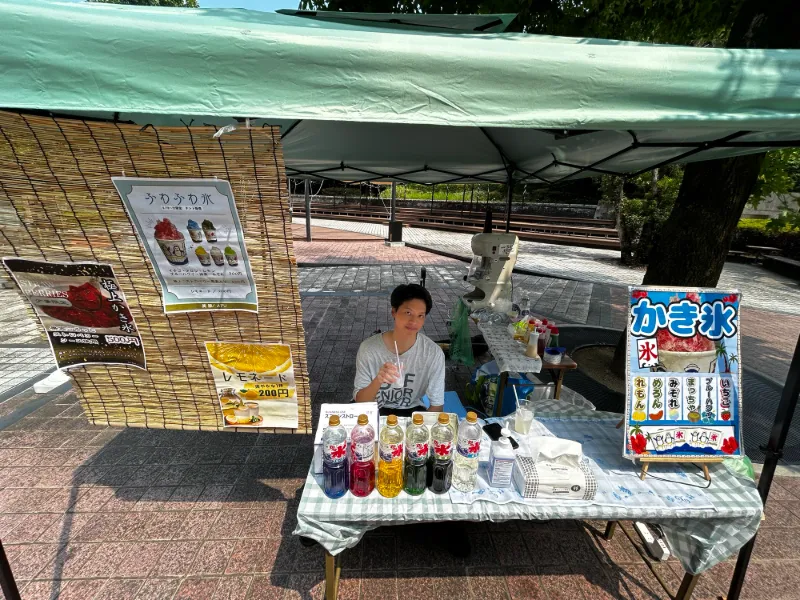
    Pann at the shaved-ice stand under a tent at Beppu City Hall
    18–22 August · Beppu City Hall
    Permits in JapaneseCustomer dataPricingSales

    Read the full story →

    VentureMar 2021 – Apr 2025

    OpenMirai

    4 yrs 2 mos · Bangkok · Hybrid

    Co-founder · Strategy, Marketing & Sales

    • One of five co-founders who took an EdTech SaaS from first idea to company: a platform that lets tutors and academies launch their own branded online schools.
    • Shaped the product concept from the first brainstorms, and co-built the business from nothing.
    • Led company strategy, including positioning and subscription pricing with zero commission on course sales, for Thai and English-speaking markets.
    • Shared marketing and sales with fellow co-founders, bringing schools off WordPress and Google Classroom onto the platform, with published customer stories from Pixelmath Education and 1Clickmath.
    • Supported investor relations alongside the CEO.
    StrategyPositioning & pricingMarketingSales

    Visit openmirai.com

    Read moreShow less: what is an LMS?

    A learning management system (LMS) is software for creating, selling and running online courses. Schools and tutors often piece this together from a website builder, a video host, a payment tool and spreadsheets.

    OpenMirai puts those pieces in one place, so an educator can go from sign-up to a published course in days. I was one of five co-founders. My part was strategy, marketing and sales, with support on investor relations.

    VolunteerJul – Oct 2021

    Swift Coding Club Thailand

    4 mos

    Teacher Assistant

    • Helped young developers learn Swift programming fundamentals using Apple's Swift Playgrounds.
    • Guided student teams through idea generation, development and final pitch presentations.
    VolunteerJul 2019

    Thailand Institute of Justice

    1 mo

    Data Analyst

    • Joined the data entry and analysis team, working with more than 60 participants (developers, data analysts and government officials) to build open datasets for anti-corruption transparency.
    • Partnered with UNODC, ChangeFusion, Opendream, Hand Social Enterprise, the Anti-Corruption Organization of Thailand (ACT) and Open Data Thailand.
    • Contributed to Corrupt0 (Corrupt Zero), Thailand's first structured anti-corruption open data platform.
    Read moreShow less: about TIJ

    The Thailand Institute of Justice is a public organization that works on criminal justice, the rule of law and sustainable development. It is affiliated with the United Nations crime prevention and criminal justice program network.

    WorkApr – May 2019

    Opendream

    Bangkok · On-site

    Quality Assurance Tester Intern · New Horizons

    • Tested New Horizons, an iOS and Android energy-sustainability game built with PTT, before release.
    • Ran post-playtest focus groups and synthesized findings on playability, comprehension, design and progression.
    • Fed findings back to the team to help reduce pre-release defects and sharpen the game's learning goals.
    QA testingFocus groupsUser research

    My first project with Opendream. I returned in 2026 as a business analyst.

    How it connects

    The evidence behind each skill

    Pick a skill to see which experiences built it, and what I actually did. Thick lines are core evidence, thin lines are supporting.

    Skill

      NextProjects →

      Projects · Pann Phetra

      Projects

      Work I can walk you through

      Case studies with the problem, the data, what I did and what I learned. Each opens in its own view.

      Venture · 2021–2025OpenMirai

      The EdTech SaaS I co-founded. See the live product.

      Visit openmirai.com
      Case study 01 · Data analysis

      20-year panel data analysis

      A research project for my coursework at APU, "Three Margins of Electricity Recovery: Coverage, Selective Entry and Generator Sizing in Japan's Municipal Incinerator Fleet, FY2005–FY2024." Being developed into a journal article. Draft in progress.

      RoleSole analyst and author
      DataJapan Ministry of the Environment, FY2005–FY2024
      ToolsPython · pandas · statsmodels · scikit-learn · LaTeX · GitHub Actions
      SupervisorProf. Han Ji, APU
      1 · The question

      Is Japan really getting more electricity from its waste?

      The headline number, about 4 in 10 incinerators generating power, counts plants. It says nothing about how much waste they handle or why some plants never add a generator.

      2 · The data problem

      Twenty yearly spreadsheets with no stable facility ID

      Official codes were missing for FY2010–FY2012 and completely renumbered between FY2019 and FY2020, so the same plant could not simply be followed over time.

      3 · What I built

      An audited, reproducible data pipeline

      Parsed every workbook, matched plants across years into 1,690 facility histories with every uncertain link documented, then built models on top. Automated checks re-verify each claim in the paper against the data.

      4 · What I found

      Three separate stories hidden in one number

      Generating plants handle 80% of the waste, big plants are far likelier to add generators, and older plants produce less because their generators are smaller.

      Japan reports that about 4 in 10 municipal incinerators generate electricity. That count hides the fact that those plants handle most of the country's waste.

      I linked 20 years of Ministry of the Environment facility records into audited facility histories, then separated three questions a single count mixes together.

      23,593facility records, FY2005–FY2024
      1,690facility histories reconstructed
      FY05–24fiscal years of Ministry data
      Margin 1 · Coverage

      Count versus volume

      How much waste do generating plants actually handle?

      FY2024. Since FY2005, the share rose 19.5 points overall but only 2.2 points among plants present in both years, so most of the rise comes from changes in which plants exist.

      Margin 2 · Entry

      Who starts generating

      Which plants report a generator for the first time?

      100 t/day plant2.5entries per 1,000 plant-years
      300 t/day plant16.7entries per 1,000 plant-years

      First-time adoption is rare (35 modeled events). Larger plants are far more likely to add generation: odds ratio 6.72 (95% CI 4.31–12.46), from a Firth logistic model with lineage bootstrap.

      Margin 3 · Components

      Why older plants produce less

      Installed size, how hard it runs, or how much waste it gets?

      Installed generator size compared with plants built from 2010. Older plants do not run their generators less. Their generators are smaller, and sizing is the largest part of every output gap.

      Explore the data

      Six views of the analysis

      All figures come from the paper's reproducible pipeline. Hover or tap the charts to read exact values.

      A

      From raw spreadsheets to a model-ready panel

      Each step removes records that cannot answer the question. The width of each bar is to scale.

      B

      Two decades of electricity recovery

      The share of plants with a generator rises slowly, while the share of waste they handle stays far higher.

      C

      Who handles Japan's waste, FY2024

      The same four groups of plants, measured three ways.

      D

      Try it: plant size and first-time adoption

      Model-predicted chance that a plant without a generator reports one for the first time next year.

      Plant size100tonnes per day
      Expected entries2.5per 1,000 plant-years

      Dots are the paper's estimates, with 95% bootstrap intervals shaded. Values between dots are interpolated. Only about 1% of plant-years are 300 t/day or larger.

      E

      Why older plants generate less

      Adjusted difference from plants built in 2010 or later, with 95% intervals. Switch between the two parts of the story.

      Decomposition of the output gap versus 2010-or-later plants (log points, 6,511 generator-years)
      BuiltGenerator sizingCapacity factorWaste loadingTotal gapSizing share of all components
      F

      Rebuilding facility identity across broken codes

      Year-to-year overlap of official facility codes versus my reconstructed facility histories.

      Official codes are missing in FY2010–FY2012 and change completely between FY2019 and FY2020. The reconstructed histories stay above 93% continuity every year, including 1,064 links restored across the 2019–2020 break.

      Methods and tools

      Administrative record linkagePanel dataFirth logistic regressionCluster bootstrapDecomposition analysisPythonLaTeXReproducible pipeline
      Full paper and code available on request

      The draft and analysis pipeline are private while the paper is in progress. Happy to walk you through them in an interview or share access.

      Contact me
      Read moreShow less: why this matters and what it does not claim

      National statistics on waste-to-energy usually count facilities. This study shows that counts, waste volumes, adoption and plant design tell different stories, so policy aimed at "more plants generating" can miss where the output gap actually is.

      The records had no reliable facility ID across the full period: official codes are missing for FY2010–FY2012 and change completely between FY2019 and FY2020. Rebuilding facility histories across those breaks was a core part of the work, and every uncertain link is documented.

      • The design is observational. It does not measure the causal effect of a retrofit.
      • Gross generation is not the same as net electricity exported, heat recovered or emissions avoided.
      • A first reported generator is not always a physical retrofit. It can reflect a rebuild or a change in reporting.
      What this project shows
      Messy data at scale

      Cleaned and merged 20 years of inconsistent government spreadsheets into one panel.

      Entity resolution

      Matched facilities across broken and changed IDs, with an audit trail for every uncertain match.

      Statistical modeling

      Rare-event logistic regression, bootstrap confidence intervals and decomposition analysis.

      Honest communication

      Separated what the data shows from what it cannot, and explained results in plain terms.

      Reproducibility

      A one-command pipeline with automated tests and claim checks that run on every change.

      Case study 02 · AI engineering

      Iris: an always-on personal AI agent

      A self-hosted assistant I designed, deployed and run. It works through chat apps, remembers context, and sends each task to the right AI model based on cost and privacy. Live since 22 September 2026.

      Illustrative demo with sample data: at 07:00 Iris posts a morning brief with today's schedule, three deadlines and five emails needing a reply. I ask it to prep me for a 2pm client call and draft replies to two client emails. It routes the request to the drafting model, posts a call brief built from past emails, and says two reply drafts are ready in Iris and nothing is sent until I review them. I ask for a Friday reminder; it adds the task and replies "Done."

      Iris · how it works

      It starts the day for me

      A brief lands at 07:00. Then I ask for what I need: call prep from past emails, reply drafts, a follow-up on Friday. Nothing goes out without my review.

      For a small team, the same setup could help turn the morning inbox scramble into one brief, clear priorities and drafts ready to check.

      Illustrative demo · sample data

      RoleDesigner, builder and operator
      StatusLive since 22 Sep 2026, always on · Phase 2 in November 2026
      StackHermes Agent · Ubuntu VPS · llama.cpp · Docker · GitHub Actions
      ModelsClaude · OpenAI Codex · Gemini · local Qwen3 · Whisper
      1. GoalOne assistant that knows my context and can act safely
      2. ConstraintPrivate data never reaches a model that trains on it; cost stays low
      3. BuiltA multi-model agent with memory, backups and monitoring
      4. LessonSilent failures are the real risk, so each one gets a detector
      1

      What it’s for

      An always-on chief of staff: it sorts, tracks and drafts, so my time goes to decisions instead of admin. Every routine maps to a business use.

      What it does, and where it fits a business

      Each routine it is built to run for me, next to the same pattern applied at work.

      CapabilityFor meFor a business
      Morning briefDaily · 07:00

      Calendar, deadlines and the day’s priorities in one message.

      Daily operations brief: orders, issues and deadlines for each manager.

      Inbox triageDaily

      Email sorted into needs a reply, FYI and noise, with read-only access.

      Shared customer inbox sorted and routed, with drafts ready for a person to send.

      Voice note to actionAny time

      A Thai-English voice note becomes a task, a reminder or a researched answer.

      Field and sales staff report by voice; updates land as tasks or CRM notes.

      Market watchDaily · on big moves

      Index closes, the economic calendar and market data through the read-only Webull Thailand OpenAPI. Moves over 5% are flagged. Never buy or sell advice.

      Finance watch: FX, commodity prices, customer and competitor share moves flagged for management.

      Research and opportunitiesAs found

      News, papers, grants, events and potential clients, each scored for fit, effort and deadline.

      Lead and tender scouting, scored before sales spends time on it.

      Weekly business reportEvery Sunday

      Pipeline movement, cash and invoices, progress on goals, and decisions for next week.

      Weekly management report built from the CRM and accounting data.

      Multilingual draftingOn request

      Drafts in Thai, English and Japanese that I review before sending.

      Cross-border client communication, checked by a person.

      Less sorting, more deciding
      Nothing slips
      Help without new risk

      Coming next

      Features on the roadmap, each unlocked only after the one before it proves safe.

      November 2026Private on-site models

      A Mac mini joins the server. Client files and private data are handled by local models and never leave the machine.

      For businessOn-premise AI for sensitive data, in line with Thailand’s PDPA.

      NextLINE as a front door

      Screens and summarises incoming messages and says what matters, without replying.

      For businessLINE Official Account triage for customer messages.

      NextSpending awareness

      A monthly picture of spending, flags drift from a set budget, tracks savings goals. Reports only; it never moves money.

      For businessExpense and budget monitoring for small teams.

      LaterBooking on my behalf

      Appointments and reservations as its first outward action, starting at the lowest authority level.

      For businessMeeting scheduling and bookings for busy managers.

      LaterFast guardrail classifier

      A small, cheap classifier for routing and for checking risky actions before they run.

      For businessLower cost and faster, auditable safety checks at scale.

      LaterVoice replies

      Spoken answers, reviewed after three months of use.

      For businessVoice assistants for staff on the move.

      2

      How it works

      Messages come in from chat apps, the agent core picks a model and tools by clear rules, and a safety net watches everything.

      System map

      Tap any box to see what it does.

      CHANNELSpicks a modeluses toolsbacked up + watchedSAFETY NET

      Backups · 15 min

      Health check · hourly

      Watchdog · off-server

      TOOLS AND DATA

      Web search

      Memory

      Google

      MODELS

      Claude Sonnet

      Gemini Flash

      Claude Opus

      Local Qwen3 4B

      OpenAI Codex

      Whisper

      Telegram

      Discord

      Scheduled jobs

      Hermes Agent · agent core

      Swipe sideways to see the whole map.

      Routing map

      How every message or scheduled job finds its model. Privacy is checked first, then input type, then rules. A model decides only the unclear rest.

      memory or emailsecretspersonal · publicaudioimagetextjudgment or chatread, summariseunclearusage limit nearrate-limitedif it actsMessage orscheduled jobPrivacy classInput typeRulesClaude Sonnetmain modelAction checkGeminifree tierCodexoverflowRefusenever sentWhisperon serverGemini visionfree tierClassifieron server

      Swipe sideways to see the whole map.

      Main modelRuns on the serverCloud, free or includedBlocked or checked
      3

      Key decisions

      Three choices, each made by comparing options rather than picking a favourite.

      Framework

      Six compared, one kept.

      OpenClawNeeds 8 GB+ RAM
      LangGraphBuild the harness yourself
      CrewAIWeak for non-linear flows
      Hermes Agent ✓Memory, scheduling and 20+ chat channels in one install, light enough for a small server

      Privacy rules

      Which models may read each kind of data.

      Data typeClaudeCodexGemini
      free tier
      Local
      on server
      Memory and email✓×××
      Personal✓✓✓*✓
      Public✓✓✓✓
      Secrets××××

      * Until Phase 2, when personal data stops going to the free tier.

      Speech-to-text

      Errors on the same Thai-English voice note.

      Whisper base
      5
      Whisper small
      1

      Chose the small model despite slower loading, then added a vocabulary prompt for names and English terms.

      4

      Safety

      Several independent layers, so one mistake never becomes an action.

      Layers of defence

      Every action has to pass all of them.

      Hardened server · key-only login, firewall, auto-updates
      Least privilege · email read-only, short list of admin commands
      Outside content is data · web pages and emails cannot give orders
      Action check · recipient, target, authority level (moving into code)
      Actionoutbound to one allowlisted recipient

      Authority ladder

      Each category starts low and is promoted only on a record of good decisions. Pick one.

      The design is set; enforcement in code is being wired in, with a trial run before it blocks anything.

      Guardrail tests

      Ten scripted scenarios, re-run after every major change. Five of them:

      5

      Reliability

      Things that fail quietly are caught by checks that run on a schedule, including one outside the server.

      Monitoring rhythm

      Two hours of checks at a glance.

      Silent failure → detector

      Real failures found in the first two days, each now caught.

      What this project shows
      Systems design

      An agent framework, six model roles, search and memory joined into one system.

      Cost routing

      Each task goes to the cheapest model that meets its quality and privacy needs.

      Security thinking

      Prompt injection and misuse threat-modeled, realistic paths closed first.

      Reliability

      Backups, health checks, a watchdog, and tests that prove alerts fire.

      Documentation

      Architecture spec, recovery runbook and design guideline.

      Code and design documents available on request

      The repository is private because it holds personal configuration. I can demo the system and walk through the design in an interview.

      Contact me
      Case study 03 · Small business

      Reading the crowd

      A kakigōri pop-up at two Beppu summer festivals: a customer tally on night one, then a new menu and a price ladder on night two.

      Our shaved-ice food truck lit up at night at the Kamegawa Summer Festival, with Pann and two teammates in the window
      Night two: our food truck at the Kamegawa Summer Festival. I'm in the middle.
      ≈¥500,000

      in sales over two festival nights, counted in cash and PayPay

      ≈1,000

      cups of shaved ice, plus about 180 lemonades

      300

      cups needed to break even on night one. We sold 450.

      ≈40

      customers brought in by one local connector, at no cost

      The challenge

      A first-time student stand beside an experienced local seller, three of us on shift, and the permits in Japanese, my fourth language.

      What I did

      As vice leader: the permit paperwork in Japanese, a customer tally on night one, the ¥400 price that night, a 50-cup cap on premium cups and a closing-time price ladder.

      Result

      About ¥500,000 in sales over two nights, both past break-even, then five more selling days at Beppu City Hall.

      Beppu Bay N APU campus 02Matogahama ParkNight one · 27 July 04KamegawaNight two · 2 August 07Beppu City Hall18–22 August
      Three spots, one summerPlay the journey, or drag, tilt and tap a pin. Teal: 5- and 10-minute walking areas.Schematic, not to scale. Tap a pin to jump to that stop.

      What the walking areas show: Kamegawa's 10-minute walking area was about half of Matogahama's (0.51 against 1.0 km²), yet night two sold more. City Hall's was almost as large (0.92 km²), yet a day there sold a tenth to a thirtieth of a festival night. It suggests the events, not the neighbourhoods, brought the buyers.

      How this map was made

      Places. Venue level, not the exact stall spot: Matogahama Park and Beppu City Hall from OpenStreetMap; the Kamegawa festival from its published venue, the fishing port on the coast about 270 m east of Kamegawa station.

      Walking areas. 5- and 10-minute walks computed on OpenStreetMap's footpaths and streets with the Valhalla routing engine (walking profile), once, on 25 September 2026. Areas in km² from a local projection. They show who could walk to a stand, not how many people came.

      Distances. Straight-line (great-circle) distances on WGS 84: Matogahama to Kamegawa 5.3 km, Kamegawa to City Hall 5.2 km, Matogahama to City Hall 1.3 km.

      Map. Web Mercator display (EPSG:3857) in MapLibre GL. Dark base map © OpenStreetMap contributors © CARTO; satellite imagery Sentinel-2 cloudless 2020 by EOX (contains modified Copernicus Sentinel data); elevation from Terrain Tiles (Mapzen, AWS Open Data), shown 1.5× taller than life so the hills read.

      Related coursework. GIS and Remote Sensing (A) at APU.

      1. 02Matogahama Park · night one, 27 July
      2. 04Kamegawa fishing port · night two, 2 August
      3. 07Beppu City Hall · 18–22 August
      1. 01Six weeks outJun – Jul 2025

        Paperwork first

        Five of us from Thailand, Taiwan and Japan came up with the idea together. The Taiwanese leader held the permits; I did the paperwork in Japanese, and approval took almost three weeks.

        Permits, in Japanese
        • Food permitLocal health centre
        • Food hygiene managerOne of us took the course
        • Booth applicationsTwo festival organizers
        Supplies
        • Ice, very cheapThrough a friend's job at a fishing-supply shop with a freezer warehouse
        • Cups, overpricedBought in bulk from an expensive supplier (see stop 06)
      2. 02Night oneSun 27 July · Hi no Umi Festival, Matogahama Park

        Next to the experts

        An experienced local couple sold shaved ice next door at ¥400–500. I cut our planned ¥500 to ¥400, and we served portions 1.5× the usual size at no extra charge.

        To be the livelier stall, we wore happi coats from Don Quijote, called out in Japanese, English and Chinese, and took turns walking the crowd. The APU Co-op shop manager, well known among Beppu's school baseball players, brought about 40 customers at no cost: we had helped him host a Co-op event at APU before.

        Pann taking a selfie in front of the team's shaved-ice stall at the Hi no Umi Festival, with teammates behind the counter
        Night one: our stall, in the happi coats. ¥400 on the menu board.
        Night one: 450 cups soldBreak-even: ¥75,000 fixed costs ÷ ¥250 kept per cup = 300 cups
        Break-even · 300
        1.5×

        the portion, at ¥100 less than we planned: how a first-time stall competed with the experts next door.

      3. 03That nightAfter night one

        What the tally said

        While we sold, I logged the age group, group type and flavour behind every cup, so night two could be planned on evidence rather than guesses.

        Bought by under-19s≈74%of cups (estimated)
        Bought by families≈58%with children (estimated)
        Three flavours78%Blue Hawaii, strawberry, lemon
        Paid ¥50 for condensed milk1 in 4110 of 450 cups

        All three charts show the same 450 cups from night one. Flavours were counted; age group and group type are estimates.

        From the tally to night two

        ≈43% of cups went to under-12s, ≈58% to families

        A photo grid at the counter

        Kids chose by picture, pointing sped up ordering, and the truck had room at eye level.

        Strawberry was the #2 flavour, 28% of cups

        Premium mango and strawberry, capped at 50

        A proven flavour, parents who would pay more, ≈¥560 kept per cup against ¥350, and something rivals didn't offer.

        1 in 4 paid ¥50 for condensed milk

        Condensed milk free

        About ¥2 a cup to give, no add-on to charge, families liked it, and better value than rivals.

        Blue Hawaii and strawberry sold 58%; matcha and melon 10%

        More Blue Hawaii and strawberry syrup, less matcha and melon

        Stock matched to what actually sold.

      4. 04Night twoSat 2 August · Kamegawa Summer Festival

        The truck, at ¥500

        We moved to a rented food truck and opened with the festival at 17:00, with set stations (ice machine, syrup and serving, cash) and stock prepared in advance. With no shaved-ice seller next door, we started at ¥500, and I capped the premium cups at 50 to hold their price.

        Even at ¥500, night two sold 92 regular cups an hour before 20:00, faster than night one's 82 at ¥400, with premium cups on top. A different festival and crowd, so it is a pattern, not proof.

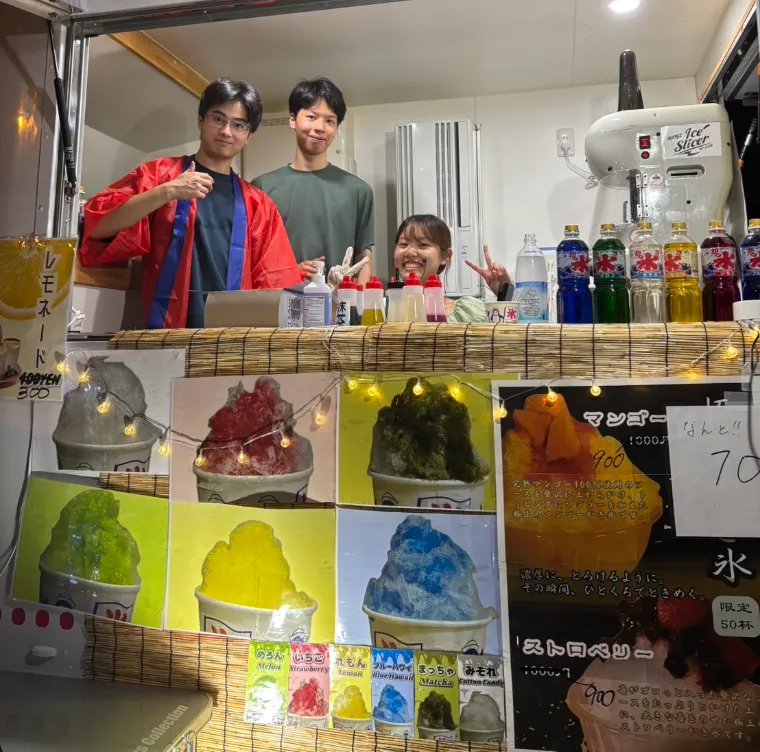
        The food truck window: Pann and two teammates behind the counter, the photo menu of every flavour, and premium mango and strawberry posters with crossed-out prices and a limit of 50 cups
        The night-two menu: a photo grid, premium cups "limited to 50", and prices crossed out as the night went on.
        Night one and night two, side by side
        ItemNight one · 27 JulyNight two · 2 August
        FormatStall, Hi no Umi FestivalFood truck, Kamegawa Summer Festival
        Next doorAn experienced local seller, ¥400–500No shaved-ice seller
        Regular cup¥400 (planned ¥500), 1.5× portion¥500, then a ladder down to ¥300 after 20:00
        Condensed milk+¥50, taken by 1 in 4Free
        MenuFlavour posters above the stallA photo grid at the counter
        Premium cups—Mango and strawberry, capped at 50, ¥900–1,000
        Lemonade—≈178, mostly ¥200
        Fixed costs≈¥75,000≈¥100,000
        Selling hours16:00–21:3017:00–21:30
        Shaved ice sold450 cups≈540–660 cups
        Cups per hour≈82≈120–145
        Sales≈¥185,000≈¥315,000
      5. 0520:00 – 21:30The last 90 minutes

        The price ladder

        By 20:00 the ¥500 cups alone had kept about ¥97,000 after ingredients, nearly all of the night's ¥100,000 fixed costs. From then on, any cup priced above its ¥150 ingredient cost still earned, so I proposed stepping the price down toward closing.

        Night two, step by step
        Ingredients, ¥150Kept per cupEstimated range
        Price, amount kept per cup and cups sold per hour through night two
        TimePriceKept per cupCups per hour
        17:00–20:00¥500¥35092276 cups
        20:00–20:30¥400¥250≈140–220≈210–330 cups, estimated
        20:30–21:00¥350¥200
        21:00–21:30¥300¥150

        Ladder cups weren't logged by step; they're what is left of the counted total. The ladder began when the fireworks started at 20:00 and ran to the festival's close at 21:30, so the crowd, not only the lower price, drove the rush.

      6. 06The moneyTwo nights, counted

        Where the ¥500,000 came from

        We counted the cash and PayPay at the time. Premium cups kept the most per sale (¥560, against ¥350 for a regular cup), and a ¥200 lemonade kept about ¥157, more than a ¥300 cup of shaved ice. The weak spot was our own buying: ordered direct, a regular serving would have cost under ¥100.

        How the total adds upEach bar starts where the one above ended. Hatched: the part left over from the counted total.
        Night one450 cups + milk add-ons
        ≈¥185,000
        Night two at ¥500276 regular cups
        ¥138,000
        Premium cups50, capped
        ≈¥45,000
        Lemonade≈178, mostly ¥200
        ≈¥40,000
        Price ladderthe rest
        ≈¥85,000–98,000
        Two nightscounted
        ≈¥500,000
        ¥157

        kept on a ¥200 lemonade: more than a ¥300 cup of shaved ice.

      7. 0718 – 22 AugustBeppu City Hall

        Five more days at City Hall

        The city opened City Hall to local businesses for two weeks. A Japanese teammate and I set up a five-day stand there at ¥300 a cup, and I worked three of the days. Our buyers were City Hall staff and visitors on errands.

        • Foot traffic comes first. Without a festival crowd, a day sold ¥10,000–20,000.
        • Two people were enough for a steady daytime pace.
        • Heat drove sales: hot days sold noticeably more.
        • ¥300 still worked because there was no truck to rent.
        Pann at the shaved-ice stand under a tent at Beppu City Hall
        Our stand at Beppu City Hall.
        Sales in a single dayA festival night sold roughly 10–30 times a City Hall day.
        Night onefestival
        ≈¥185,000
        Night twofestival
        ≈¥315,000
        A City Hall dayrange
        ¥10,000–20,000
      The calls I made
      Cut night one's price from ¥500 to ¥400

      An experienced seller next door charged ¥400–500 for a similar cup.

      450 cups sold, 150 past break-even.

      Recorded who bought, and what

      To plan night two on evidence rather than guesses.

      Under-19s bought about 3 in 4 cups and three flavours sold 78%. Night two got a new menu, premium cups, free condensed milk, and stock planned for the rush.

      Capped premium cups at 50

      Scarcity to hold a higher price.

      4 in 5 sold at full price, keeping ≈¥560 a cup against ¥350.

      Proposed the price ladder

      With fixed costs nearly covered, any price above ¥150 still earned.

      ≈210–330 cups in the last 90 minutes, each still keeping at least ¥150.

      What I'd do differently
      1. Buy cups direct

        Under ¥100 a serving instead of about ¥150: roughly ¥50,000 more kept over the two nights.

      2. Log sales at every price step

        The ladder's cups are worked out from the total. A tally per step would have measured what the price cuts did.

      3. Count our own time

        Three of us worked unpaid. An hourly wage belongs in the break-even before calling a night profitable.

      The two-night total was counted in cash and PayPay. Figures for each product come from our notes and memory and are rounded; night-two sales and price-ladder cups are what remains of the total. Sales are revenue, not profit.

      Case study 04 · Marketing analytics

      Where should the next marketing dollar go?

      My Google Data Analytics capstone: a year of the Google Merchandise Store's analytics (Aug 2016 – Aug 2017, 903,653 visits in BigQuery), worked around the two decisions its Head of Marketing has to make.

      RoleSole analyst · Sep 2026
      DataGoogle Analytics 360 sample, BigQuery
      ToolsBigQuery SQL · BigQuery ML · Python · scikit-learn · statsmodels
      OutputMemo · 14-slide deck · public repo with tests
      41%

      of the store's revenue came from Google's own employees, not from marketing. The public data hides them as "Referral"; Google's training copy shows the source, the internal employee store link.

      5%of visitors
      47%of purchase sessions
      99.2%precision of my employee filter, checked against that copy
      98.2%of employee purchases the filter catches

      On night one in Beppu I logged 450 cups by hand to see who was actually buying. This project asks the same question at Google's scale: who is buying, and what should change?

      The short answer
      Which channels deserve the budget?

      Don't move money on GA's channel report: it likely gives Organic Search up to about 15 points of purchase credit that returning visitors earned. Keep Paid Search, but bid below what a click can be worth. Hold Display's budget until a test shows what it adds.

      Moderate on Organic Search; low on what the ads cause, which only a test can show.

      Which first-time visitors are worth bringing back?

      Only the top-scored ones. A model's top 10% holds 71% of later buyers, but retargeting them is worth only about $700–$760 a month before ad costs. Measure the real lift with a 50/50 test.

      High for the ranking; low for the lift, which is borrowed from other companies' experiments.

      No "move X% of budget to channel Y", on purpose: the data has no ad costs, and credit for a sale isn't the same as causing it. I sized the tests that would settle it instead.

      1. AskTwo decisions, four hypotheses with pre-set tests
      2. PrepareCredibility check; employee traffic found
      3. ProcessOne clean session table, 15 validation checks
      4. AnalyzeLab audit, retargeting model, attribution, test design
      5. ShareMemo, 14-slide deck, dashboard guide
      6. ActEight actions: four now, two tests, two to explore
      01

      Google's teaching model mostly finds employees

      Google's BigQuery ML lab (GSP229) asks whether a first-time visitor will buy later. I rebuilt it from the lab's own SQL and got its published scores back (0.724 / 0.909 against 0.72 / 0.91). It looks excellent mainly because 61% of the buyers it learns from are employees: of the 1,020 visitors it ranks highest, only 2 were outside customers who went on to buy.

      Scored only on outside visitors, its ROC-AUC drops from 0.910 to 0.863. Fine for teaching; take internal traffic out before targeting anyone.

      Employees among the lab model's "likely buyers"Share of first-time visitors who are Google employees, May–Jun 2017
      Top 1% of scores98.8%
      Top 5%87.9%
      Top 10%76.8%
      All first visits9.4%
      02

      GA's report gives Organic Search credit that returning visitors earned

      When someone comes back by bookmark or typed address, GA hands the sale to the last campaign they arrived from. I rebuilt the journeys behind 5,058 outside purchases and let a data-driven model (a third-order Markov chain) share out the credit. It gives Organic Search 38.2% of purchases, not GA's 53.8%. Visitors returning on their own bring 34% of purchases.

      15.5points if every direct return was self-initiated (95% CI 14.4–16.6)
      13–15at a benchmark from how returning visitors behave
      1.8on GA's own labels
      Where GA's report puts the creditData-driven share of purchases minus GA's share, in points
      Direct
      +16.7
      Display
      −0.2
      Paid Search
      −0.7
      Referral
      −0.8
      Organic Search
      −15.5

      GA over-creditsGA under-credits

      03

      One office desktop made Display look like a winner

      One outside visitor came 278 times, on weekdays during office hours, and had already placed a large order before its only Display click. GA remembers campaigns, so it labelled the account's next 15 purchases "Display". That one account is 89% of everything GA credits to Display. I report it on its own, like employees: without it, a Display click is credited with $2.84–$3.87 under every rule.

      The key account's timeline16 purchase sessions, $128,413: 15% of outside revenue
      1. A $17,860 orderGA labels it Direct: already a customer
      2. Its only Display clickNo purchase on that visit
      3. 15 purchases, $110,553All return visits; GA labels each one Display
      04

      A Paid Search click is worth less than its credit suggests

      Every attribution rule I tested credits a Paid Search click with $1.56–$2.43 of revenue. At a 50% margin that makes $0.78–$1.21 the most a click is worth bidding, and only if every sale needed the ad. Many probably didn't: all 65 Paid Search purchases with a readable keyword came from searches for the store or its brand.

      77% of Paid Search purchases have no readable keyword, so the brand share can't be measured in full. I treat the value as a ceiling, not a profit.

      Bid cap per Paid Search clickAt a 50% gross margin
      If the ads caused…Bid cap per click
      every attributed sale$0.78–$1.21
      half of them$0.39–$0.61
      a quarter of them$0.19–$0.30

      65 of 65 readable keywords behind a Paid Search purchase were brand searches.

      05

      A model finds tomorrow's buyers, but they're worth less than you'd hope

      Scored at their first visit, the top 10% of first-time visitors held 71% of the outside customers who bought within the next 30 days (228 of 323; 95% CI 65–75%). A two-line rule, North American visitors first, then how far they got toward checkout, reached 61%, so the model's edge is real but modest.

      The money is small: retargeting the top 10% is worth about $700–$760 a month in extra gross profit before ad costs, and $930–$960 for the top 20%.

      A gradient-boosting model, tuned with time-based folds and an embargo, tested once on months it never saw (May–Jun 2017), with no hindsight about who is an employee.

      Later buyers reached by targeting the top 10%
      My model (gradient boosting)71%
      Two-line rule61%
      Random targeting10%
      Most worth paying to bring one visitor backBy score band · 30 days · assumes a 10% lift and 50% margin
      What I'd do on Monday
      Now

      Report employees and the key account as their own segmentsWeb analytics · 41% of revenue; $128k

      Show a multi-touch view beside GA's channel reportMarketing, Finance · up to ~15 points of credit

      Split brand from non-brand search; bid under the ceilingPaid media · $1.56–$2.43 attributed per click

      Review spend on YouTube promotion and affiliatesPaid media · ~98,000 YouTube visits, no purchases

      Test

      Retarget the top 20% with a 50/50 holdout for 12 monthsRetargeting lead · $700–$960 a month

      Hold Display's budget; run a 12-week holdout on site visitsPaid media · ~$17k of revenue a year

      Explore

      Retention: email and reminders for past visitorsHead of Marketing · 34% of purchases

      A direct sales path for corporate buyersMarketing, Sales · $248,552 of bulk purchases

      High confidence

      Employee traffic, checked against Google's unredacted data

      The key account's timeline, from its own visits

      The retargeting ranking, tested on unseen months: 7–10 points ahead of the two-line rule

      Moderate

      Organic Search's over-credit: the direction is clear, the size rests on an assumption

      The returning-visitor share (34%), for the same reason

      Retargeting's value: it assumes a 10% lift and a 50% margin

      Low

      Whether Paid Search clicks are incremental

      What Display adds

      The retargeting lift, borrowed from published experiments

      Where I got it wrong

      Mistakes I caught along the way, each recorded in the decision logs:

      • I assumed Google's lab used the public dataset. It uses a fuller table, so I redid the audit on the lab's own data: an estimated employee share (53%) became a verified one (61%).
      • An ID that looked unique wasn't. It repeats for visits split at midnight; joining on it duplicated 1,666 rows.
      • A memoryless model over-credited Social nearly threefold; a third-order chain fixed most of it.
      • A two-day overlap flipped my model choice. One tuning fold let labels from Jan 30–31 see 30 days ahead into the validation months. Fixed, gradient boosting edged past the random forest (0.0705 vs 0.0700); my rule, set before testing, takes the higher score, so I switched, even though the headline dipped from 72% to 71%.

      Before calling it done, I ran an AI-assisted red-team review that re-derived every headline from the data. It changed six conclusions, including:

      • Display was mostly one corporate buyer, now reported on its own.
      • "Direct" mixed returning visitors with first visits: they bring 34% of purchases, not the half I first reported.
      • Both proposed tests were too small to detect their effects, so I sized designs that can.
      What this project shows
      Question the data first

      Employees and one corporate buyer changed almost every channel number, found before any model.

      Attribution modelling

      A third-order Markov chain with a value-weighted removal effect and a paired bootstrap, against GA's report.

      Honest machine learning

      Time-based folds, one test on unseen months, and a no-model rule to beat.

      Experiment design

      Power and minimum detectable effects for the two tests that would settle what attribution can't.

      Starting from the decision

      Framed around the Head of Marketing's two decisions: a memo, a deck and eight owned actions.

      Data: Google Analytics 360 sample (bigquery-public-data.google_analytics_sample) and the data-to-insights table used in Google's training labs, both published by Google for learning. Attribution describes the paths people took, not what each channel caused.

      NextEducation →

      Education · Pann Phetra

      Education

      Ritsumeikan Asia Pacific University

      Bachelor of Sustainability and Tourism · Beppu, Japan · Apr 2023 – Mar 2027 (graduation expected). All 124 required credits completed. Graduation thesis on electricity recovery in Japan’s incinerator fleet in progress (Fall 2026), supervised by Prof. Han Ji.

      Grades

      3.86Most recent semester
      3.37Cumulative GPA (4.0 scale)
      4.03.53.0 SP23FA23SP24FA24SP25FA25SP26
      SemesterCumulative

      Major courses

      22A+ grades (90%+)
      32Major courses completed
      A+ 22A 8B 1Pass 1

      The college trains students to use research to solve practical problems, with project work alongside companies, governments and international organizations.

      Read moreShow less: how APU grades

      APU uses a stricter scale than many universities. An A+ requires a score of 90% or higher, and an A (80–89%) counts as only 3.0 grade points.

      GradeScorePoints
      A+90–100%4.0
      A80–89%3.0
      B70–79%2.0
      C60–69%1.0
      F0–59%0.0

      Pass/fail courses (P) are not counted in the GPA. A 3.37 cumulative GPA on this scale means most grades were A or A+.

      Show all graded coursesHide courses

      Major courses plus liberal arts and other-college electives, grouped by theme.

      Strategy and management

      • 11377Strategic ManagementA+
      • 13150Organizational BehaviorA+
      • 12674Introduction to AccountingA+
      • 12027Negotiation SkillsA+
      • 12409Introduction to ManagementA

      Behavior, economics and technology

      • 10729Behavioral & Experimental EconomicsA+
      • 10512Social PsychologyA+
      • 11019New Technologies & Future SocietyA+
      • 10614Information Processing EssentialsA+
      • 12079Statistics for Social SciencesA

      Tourism and hospitality business

      • 11238Tourism OperationsA+
      • 11250Tourism Destination Development & PlanningA+
      • 11365MICE and Event IndustryA+
      • 13085Destination MarketingA
      • 13153Revenue ManagementA

      Sustainability and resources

      • 11452Energy ManagementA+
      • 11342Pollution PreventionA+
      • 10861Resilient CitiesA+
      • 10400Politics of DevelopmentA+
      • 10718GIS and Remote SensingA
      Coursework by role

      What I studied for the job you're hiring for

      Pick a role to see the APU courses that prepare me for it, with my grades and what each one covers.

      relevant courses
      graded A or A+
      average grade points
      Nine concentrations

      My path through the nine concentrations

      APU's Sustainability and Tourism degree is built on nine concentrations: three in sustainability, three in tourism and three shared by both. Tap any concentration to see the courses I took for it, including related electives.

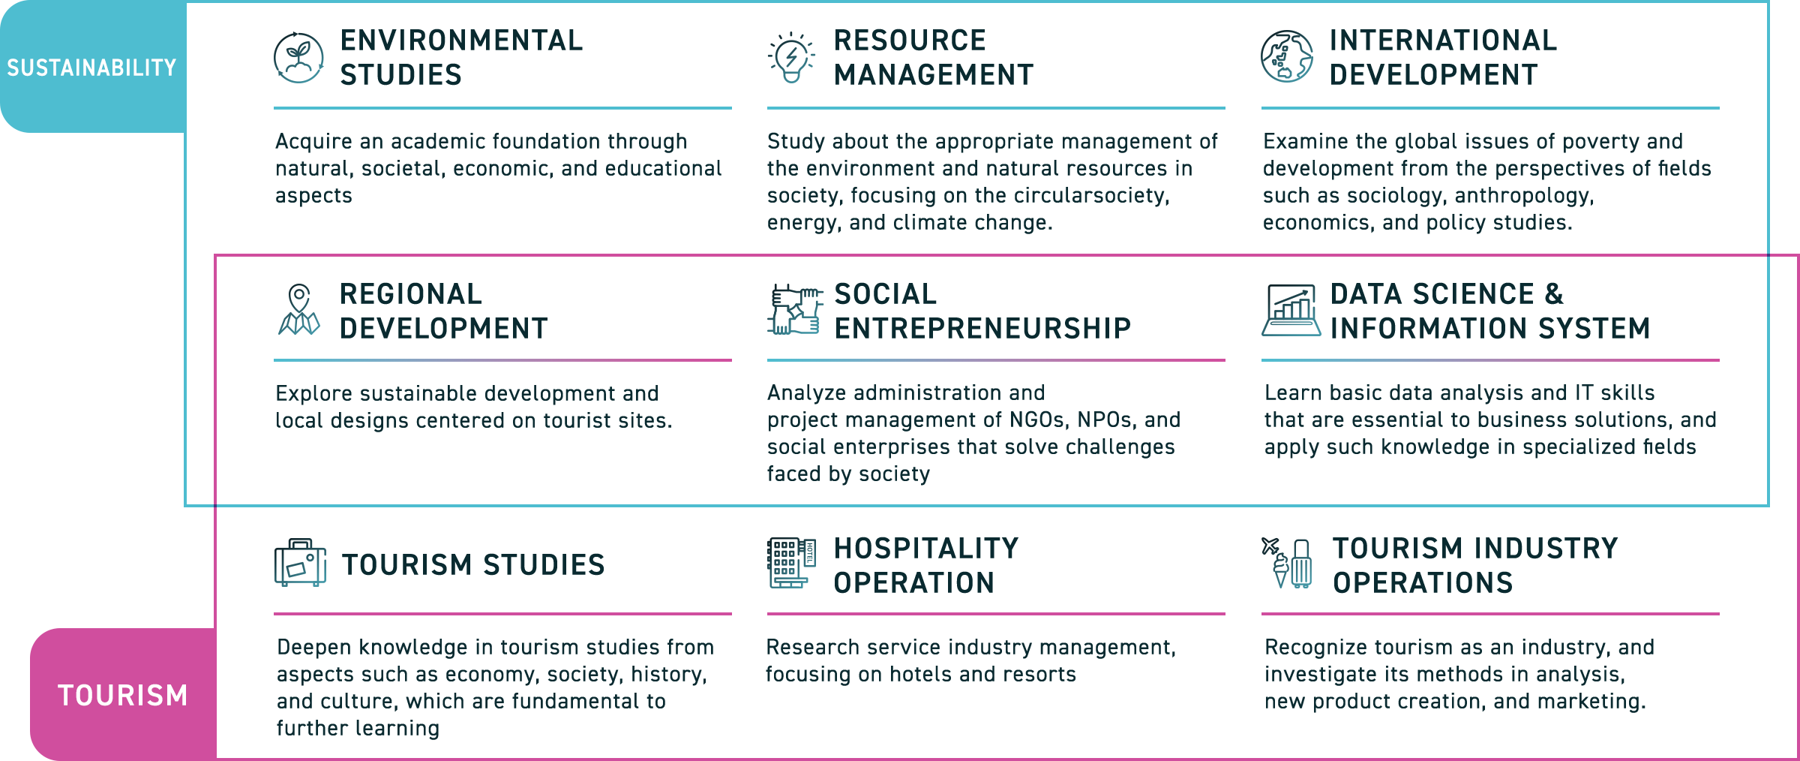
      APU's official diagram of the nine ST concentrations: Environmental Studies, Resource Management and International Development under Sustainability; Tourism Studies, Hospitality Operation and Tourism Industry Operations under Tourism; Regional Development, Social Entrepreneurship and Data Science and Information System shared by both

      Swipe sideways to read the full map.

      APU's official map of the nine concentrations. Regional Development, Social Entrepreneurship and Data Science sit where sustainability and tourism overlap, shown as the "Shared by both" row below. Source: Ritsumeikan Asia Pacific University
      23major courses across the nine concentrations
      +12related electives from liberal arts and other colleges
      9research foundation courses, plus a graduation project in progress
      Research foundationRequired for every ST student, alongside the concentrations
      Major course, A+Major course, A or BRelated electiveEach course is counted once, in its best-fit concentration. Categories follow APU's ST 2023 curriculum guide.
      Read moreShow less: what a concentration means

      A concentration is a cluster of related courses. ST students are not locked into one. They take courses across several concentrations, which is how a single degree can combine tourism, environmental science, management and data.

      Data Science & Information Systems teaches students to work with spatial and large datasets. GIS (geographic information systems) maps and analyzes data by location, and remote sensing uses satellite and aerial imagery to study land use, cities and the environment. The map in case study 03 puts both to work.

      About APU · Beppu, Japan

      Half the campus comes from abroad.

      Since opening in 2000, APU has kept roughly one international student for every Japanese student. Classes run in English and Japanese, and most group work mixes several nationalities.

      InternationalJapanese

      Every 100 students, roughly

      119countries and regions represented by students APU Prospectus 2027
      2,653international undergraduates, the most of any university in Japan Asahi Shimbun 2026
      46%of faculty are international, #1 among Japanese universities QS 2026 · APU Prospectus 2027
      98%of classes offered in both English and Japanese APU Prospectus 2027
      THE Japan University Rankings 2025#4private university in Japan
      #1 in Western Japan, 7 years running#2 nationally for international environment#3 nationally for student engagement, 4 years running
      QS World University Rankings by Subject101–150worldwide in Hospitality & Leisure Management
      The only Japanese university in the ranking
      QS World University Rankings 2026#1in Japan for international students and international faculty
      Where APU graduates are hired
      AccentureDeloittePwCFujitsuHitachiCapgeminiHondaNissanDaikinMitsubishi ElectricKomatsuJALANAJR KyushuHiltonFast RetailingSuntoryNitoriMizuho SecuritiesSMBC NikkoBank of JapanSompo JapanJICAJETROTata Consultancy ServicesCyberAgent
      Read moreShow less: what these numbers mean

      50% international, 119 countries. Since opening in 2000, APU has kept roughly half its students international; the 2027 prospectus puts it at 50%, #1 among Japanese universities (QS 2026). In a typical class, a student works with people from several countries, in English or Japanese.

      THE Japan University Rankings. Times Higher Education ranks Japanese universities on four areas: resources, student engagement, outcomes (reputation with academics and employers) and international environment. APU placed 4th among private universities in Japan in 2025, 1st in Western Japan for the seventh year in a row, and 2nd nationally for international environment.

      QS Hospitality & Leisure. QS World University Rankings by Subject compares universities worldwide in each field, based mainly on global surveys of academics and employers plus research impact. APU places 101–150 in the world in this subject and is the only Japanese university in the ranking.

      NextCredentials →

      Credentials · Pann Phetra

      Honors, exchange and certificates

      Recognition

      Scholarship · Apr 2023Ritsumeikan Asia Pacific University

      APU Tuition Reduction Scholarship

      An 80% tuition reduction for all four years of study, awarded on merit.

      Read moreShow less: what this scholarship means

      APU offers tuition reduction scholarships to international students at several levels, based on their application and academic record. The 80% level is one of the higher awards, and it covers the full four-year program.

      Certificate · Sep 2026Google · Coursera

      Google Data Analytics Professional Certificate

      Issued by Google through Coursera · September 2026 · Credential ID AIGHNUB1RF3U

      Google's job-ready program for entry-level data analysts, built around the tools and workflow analysts use every day.

      • Practiced the full analysis workflow: framing the business question, cleaning and preparing data, analysis, visualization and presenting recommendations to stakeholders.
      • Hands-on with SQL in BigQuery, spreadsheets, Python and Tableau dashboards.
      • Nine courses and 180+ hours; recommended by the American Council on Education for up to 12 U.S. college credits.
      • Capstone: where the Google Merchandise Store should spend its next marketing dollar. Read the case study.
      SQLData analysisTableauBigQuerySpreadsheetsPythonData cleaningData storytelling
      Show credential
      Exchange · Oct – Nov 2022Waseda University · JST

      Sakura Science Exchange Program, Waseda University

      Educational Innovation and Communication Studies · Tokorozawa Campus

      Selected by the Japan Science and Technology Agency (JST), Japan's national science agency, for a fully funded exchange at Waseda University's Graduate School of Human Sciences, studying how technology is reshaping school education.

      • Saw digital textbook platforms demonstrated at Tokyo Shoseki, Japan's leading textbook publisher.
      • Observed ICT-integrated lessons in elementary and junior high schools in Saitama Prefecture.
      • Workshopped technology-driven education reform with Waseda graduate students.
      • Collaborated with participants from Thailand, Vietnam, Kazakhstan, China and Japan.
      • Came while I was co-running OpenMirai, so I studied school EdTech adoption from a builder's side.
      Read moreShow less: what Sakura Science is

      The Sakura Science Exchange Program is run by the Japan Science and Technology Agency, a national agency under Japan’s Ministry of Education. It invites selected young people from Asia to Japanese universities and research institutes for short, fully funded programs in science and technology.

      Waseda University in Tokyo is one of Japan’s leading private universities.

      Certificate · Mar 2026Ministry of Public Health, Thailand

      Thai Massage Therapist

      Ministry of Public Health of Thailand

      A government-issued certification in Thai massage and human anatomy. It connects to my coursework in health and wellness tourism, one of Thailand's growth sectors.

      Languages and skills

      Tools I work with

      Languages

      Thai
      Native
      English
      Near-native
      Japanese
      Business level
      Chinese
      Limited working

      Japanese is my fourth language: I learned it at APU, through the language track from Foundation to Pre-Advanced (20 credits).

      Read moreShow less: what the levels mean
      • Native: first language
      • Near-native: works, studies and writes professionally in the language. My APU degree was taught in English
      • Business level: can hold meetings, read documents and write emails in a work setting
      • Limited working: handles everyday conversation and routine work tasks

      Product and business

      Product strategyRequirements analysisFunctional testingSaaS pricingGo-to-marketUser onboarding

      Research and data

      SQLPythonTableauSpreadsheetsStatisticsGISFocus groupsQualitative research

      Working across markets

      LocalizationWorking with Japanese teamsMulticultural teamsNegotiation
      NextBack to Overview →
      Contact

      Let's talk about your team

      Open to full-time roles in Bangkok as a business analyst, solutions consultant or data analyst.

      It's in Bangkok

      Pann Phetra on a train platform in Japan